Transit, Tools, and Tokyo

I have been a car hater for many years: if I do not need a car, it simply does not make sense to own:
- a quickly depreciating asset
- with high operating costs (fuel, parking, fixes)
- that is actively hurting the environment
- while spending most of its time just…sitting there
In other words, I am a hardcore Public Transportation fan.
I bring this up because I’m planning to move, and am unsure if I want to stay in my current neighborhood, or try out another part of Chicago. Given what I just shared above, the accessibility of an area via public transportation is a critical input into my decision.
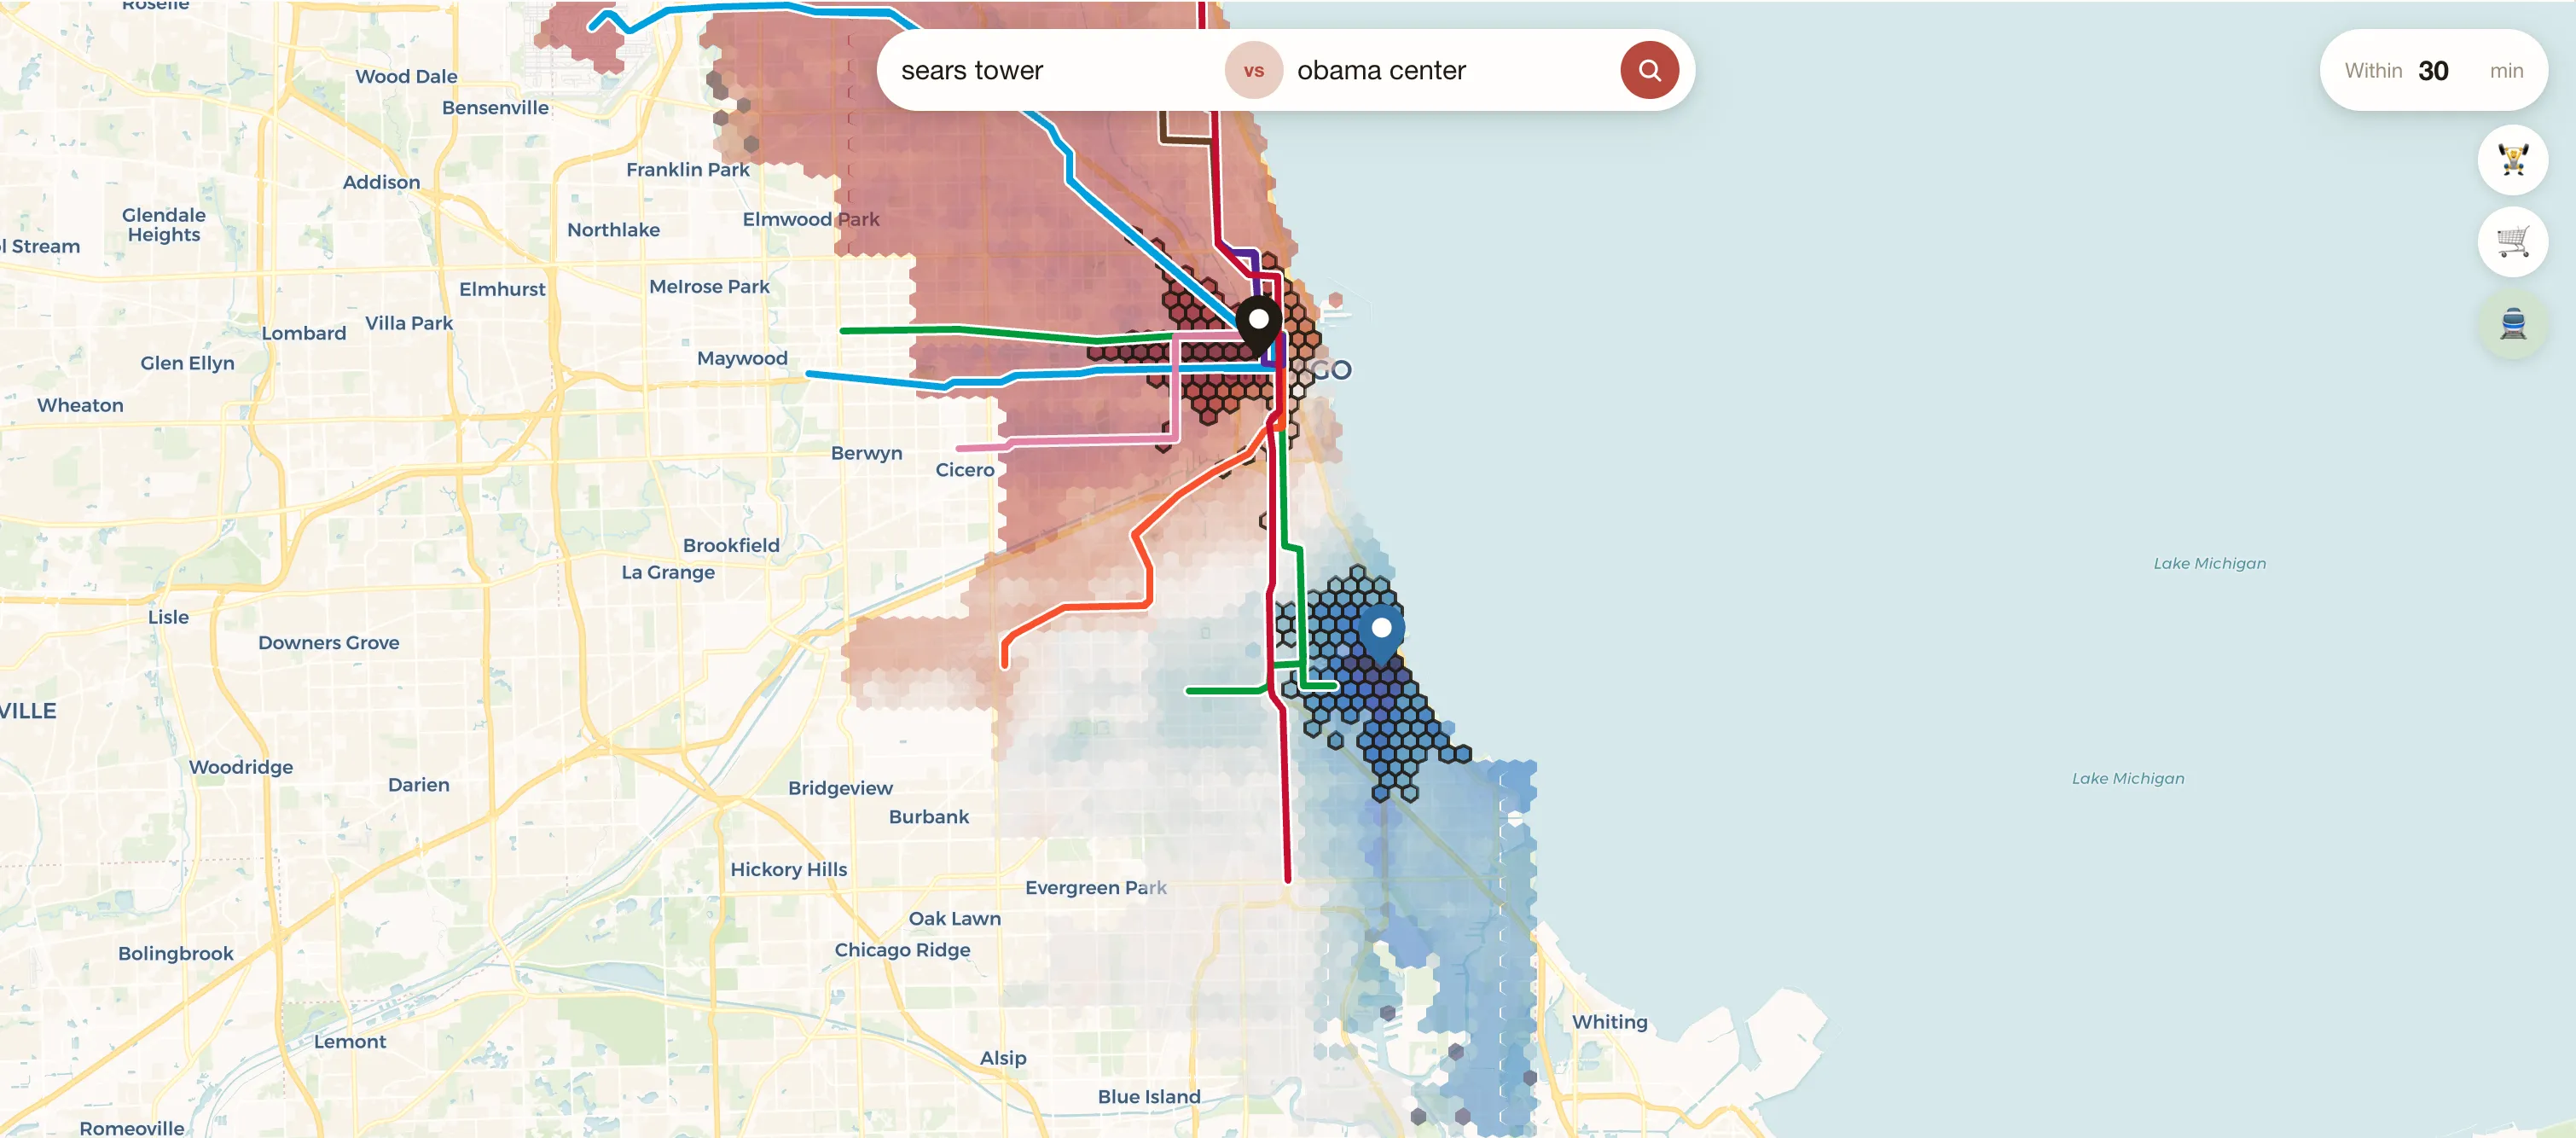
So I built a tool to help me visualize the accessibility of any area in Chicago, along with the implications if I move:
This article dives into how the tool works and what I learned about Chicago during this journey. As a bonus, I used the tools I built to answer another question: is Japan’s transit system REALLY that much better than what we have in the US?
Let’s go!
How does this work?
So in order to figure out where I want to live, I needed to get 3 data inputs:
- Accessibility - how long does it take to travel from this place to anywhere else in the city, via public transportation?
- Gym and grocery store access - I want to be near good gyms and grocery stores, to make my life easy
- Rental costs - ideally, I’m not living in the most expensive parts of the city.
For Accessibility, my original idea was to slam the Google Maps API with a bunch of search queries from any point in Chicago to any other point in Chicago. This sort of boil-the-ocean approach seemed to be the easiest way to try and get the data that I wanted.
After some exploration, however, I ended up utilizing R5 in order to quickly estimate durations between points leveraging GTFS data from the CTA. Not sharing details here cause it’s kind of boring, but I did stumble upon this fascinating article about the origins of GTFS that I do strongly recommend!
For understanding where gyms and grocery stores were, I leveraged the Places API from Google.
And finally, for Rental cost estimates, I utilized ZORI estimates from Zillow. Unfortunately, this data is not particularly granular (most granular data is at a Zip Code level, and doesn’t filter by TYPE of rental). But, I don’t really have anything better, and it should at least be directionally correct.
Findings
Accessibility Across Chicago
First, I was curious how accessible different parts of Chicago were relative to each other. I conceptualized this as, “from any point in Chicago, how many other places can be accessed easily from that location?”. This led me to creating a metric: Accessible Area.
I turned Chicago into a grid of points, then iterated through the grid and calculated the Accessible Area for each point.
That generated the heat map that you see on the right. Lighter colors mean that that location can access more places within 30 minutes. Unsurprisingly, we see that the most accessible areas tend to be in the center of the city, clustered around the train lines.
We can see this more clearly when we plot the 10 hexes with the highest accessibility along with the train lines of the city. All of the highest accessibility locations are along a major train line.
Interestingly enough, I currently live in Logan Square, which makes it in the top 10 list of highest accessibility areas. So, by dumb luck, I was able to move to a great location when I first moved to the city last year.
Gym/Grocery Store Access
Next, I plotted how many gyms/grocery stores were within 30 minutes of each grid point. Although grocery stores seem to be found across Chicago (though some clear deserts can be seen across the edges of the city and the South Side), gyms are extremely concentrated in the North East parts of the city.
This is not surprising: the North East tends to have more affluent/younger populations, and (I suspect) those populations are more willing to spend on gym memberships than other demographics.
Gym Accessibility <30 min
Grocery Store Accessibility <30 min
Do I want to move to another area?
Given the accessibility information along with the access to gyms and grocery stores, we can finally answer the question that motivated this original work: do I want to move?
| Neighborhood | Gyms sub 15 min | Grocery sub 15 min | Grocery sub 30 min | ZORI $/mo |
|---|---|---|---|---|
| McKinley Park | 2 | 5 | 119 | 1,610 |
| The Loop | 17 | 19 | 112 | 2,480 |
| The Loop | 14 | 18 | 103 | 3,040 |
| Logan Square | 4 | 8 | 96 | 2,340 |
| Armour Square | 7 | 17 | 82 | 1,800 |
| The Loop | 11 | 15 | 86 | 2,760 |
| Avondale | 6 | 9 | 90 | 2,260 |
| McKinley Park | 1 | 5 | 100 | 1,550 |
| The Loop | 8 | 9 | 105 | 3,040 |
| West Town | 10 | 8 | 84 | 2,690 |
Here’s a table outlining the 10 areas in Chicago with the greatest public transportation accessibility, AND have at least 1 gym within and 1 grocery store within 15 minutes.
Like I stated earlier, I’m in Logan Square. Admittedly, given its stats in the table, its lower price relative to the Loop, and its proximity to my favorite dance studio, I don’t think I will leave the area this next year.
That being said, this analysis did teach me about McKinley Park! It’s an area of the city that I have never been in, but its proximity to the Orange Line, along with great bus access makes it a very exciting area to explore. And, I’m surprised by how much more affordable the neighborhood is compared to the other locations in my Top 10 list.
US vs. The World
As I worked on this project, I had an insight: the Accessible Area metric was actually a proxy for the quality of a city’s transport system! I could actually use this measure in order to compare how good Chicago’s public transportation was compared to other cities around the world.
Obviously, this is imperfect measure:
- Quality of a public transport system is so much more than a utilitarian estimate of reachable surface area: cleanliness, reliability, safety, etc. all also matter
- I’m only using a single point within a city (its most connected location) to judge the quality for a whole city - I’m doing this because it’s easy, but it’s CLEARLY not a great way to judge a whole city’s system
My counterpoint to these objections is: I don’t care, this is my article.
I was especially curious about a belief that I had: that public transportation in Tokyo (and East Asia in general) is incomparably better than what’s available in the US. So I decided to analyze Accessible Area across Chicago, NYC, and Tokyo to validate if my intuition was accurate.
Accessibility Comparisons
I created the same heatmaps for NYC and Tokyo that we looked at earlier for Chicago, in order to find the most well connected areas of the city. Then, I compiled the Top 20 locations that could reach the most area within 30 minutes across ALL of the cities. I was curious how the 3 cities would compare in representation using this measure.
Most Accessible Locations
across all cities
We can see that Tokyo absolutely DOMINATES. Its most connected location has a reachable area that is 47% larger than NYCs, and 55% larger than Chicago’s! In fact, in the Top 20 list, only a single location from NYC and Chicago even make it to the list!
To help conceptualize this, I decided to plot the Accessible Area from my current neighborhood in Chicago (orange), superimposed with the area reachable from Akihabara Station (pink):
I wish I could easily access this entire area from my apartment in Chicago! However, this chart also shows that Akihabara has an unfair advantage: it can reach more places because it’s a bit further from the water than most areas of Chicago. That being said, that doesn’t fully explain the lack of US representation in this top 20 list. After all, the lake doesn’t greatly impact areas in South/West Chicago - these areas would be MUCH more accessible if public transportation in Chicago was better.
Long Distance Transit
In addition, Japan’s transit system is even BETTER than the Tokyo data suggests. First of all, it’s very clean and safe, and unbelievably reliable even with its staggering ridership numbers (Shinjuku Station averages ~670K passengers a day!).
More importantly, Japan shines in its intercity connections. As a comparison, let’s compare some long distance trips in the US vs. reasonable comparisons in Japan:
For what it’s worth, the US does prioritize other things: planes make traveling to Baltimore or NYC or DC or Chicago quite easy. Sure, in Japan a trip as far as Chicago to Baltimore might take only 7.5 hours, but today you can also just fly to Baltimore in about 2 hours. So although the speed of intercity transit is pretty incredible in Japan, it may have diminishing returns in a country as large as the US where flying is quite efficient in terms of time and cost.
Final Thoughts
What started as a way to answer a simple question, “should I move”, turned into a bit of a Frankenstein project towards the end of this journey. I never anticipated that this would let me measure how much better Tokyo’s public transit was than Chicago’s.
However, this project did leave me invigorated and excited to learn more about Chicago! There are two directions of work I’d like to explore in the future:
- How does having a bike alter the accessibility of Chicago? And can I use that to measure the most ‘bike friendly’ cities in the world?
- I may want to buy a house in Chicago in the future - before doing so, I want to expand my tool to also include information about demographics (I want diversity), school quality, HOA costs, etc.
Lastly, I want to use the tools developed for this analysis as a way to better understand local decisions about CTA investment and policy changes over time. For example, what does it mean for bus routes to be reduced/increased? How does that translate into the areas that I can reach within 30 minutes?
If you live in Chicago and want to play around with the tool, it’s here! And as always, if you have any requests/ideas on how to make it better, let me know!